In a previous post, I described a process whereby we could create structured logs that could be published to Cloudwatch. The use of Cloudwatch Embedded Metrics Format allows us to embed custom metrics in cloudwatch logs which could be extracted to create alarms or provide analysis using Cloudwatch Logs Insights.
Embedded Metric Format is a JSON specification that specifies the format of how a custom metric can be embedded within a cloud watch structured log. The example below shows a log entry from an ECS service:
{
  "_aws": {
    "Timestamp": 1583902595342,
    "CloudWatchMetrics": [
      {
        "Dimensions": [[ "ServiceName", "ServiceType" ]],
        "Metrics": [{ "Name": "ProcessingTime", "Unit": "Milliseconds" }],
        "Namespace": "aws-embedded-metrics"
      }
    ]
  },
  "ServiceName": "example",
  "ServiceType": "AWS::ECS::Container",
  "Method": "GET",
  "Url": "/test",
  "containerId": "702e4bcf1345",
  "createdAt": "2020-03-11T04:54:24.981207801Z",
  "startedAt": "2020-03-11T04:54:25.594413051Z",
  "image": "<account-id>.dkr.ecr.<region>.amazonaws.com/emf-examples:latest",
  "cluster": "emf-example",
  "taskArn": "arn:aws:ecs:<region>:<account-id>:task/2fe946f6-8a2e-41a4-8fec-c4983bad8f74",
  "ProcessingTime": 5
}
To enable support for the Flask web application in the previous post to produce EMF logs, we need to do the following as documented in Publishing logs with Embedded Metric Format.
Firstly, we need to run the Cloudwatch Agent Container as a sidecar next to the application container. The agent will be running on container port 25888 and accessible via TCP from the application container since we are using Fargate as the deployment mode which uses awsvpc mode. The agent will need a configuration file which is store in SSM. The configuration file has the following format:
{
  "logs": {
    "metrics_collected": {
      "emf": {}
    }
  }
}
The updated task definition is shown below:
[
  {
    "name": "flaskapp",
    "image": "${data.aws_ecr_repository.ecr.repository_url}",
    "cpu": 256,
    "memory": 512,
    "logConfiguration": {
      "logDriver": "awslogs",
      "options": {
        "awslogs-group": "${aws_cloudwatch_log_group.ecs_logs.name}",
        "awslogs-region": "eu-west-2",
        "awslogs-stream-prefix": "ecs"
      }
    },
    "essential": true,
    "portMappings": [
      {
        "containerPort": 5000,
        "hostPort": 5000,
        "protocol": "tcp"
      }
    ],
    "secrets": [
        {
            "name": "RDS_USERNAME",
            "valueFrom": "${aws_ssm_parameter.rds_username.arn}"
        },
                        {
            "name": "RDS_PASSWORD",
            "valueFrom": "${aws_ssm_parameter.rds_password.arn}"
        },
                        {
            "name": "RDS_DB_NAME",
            "valueFrom": "${aws_ssm_parameter.rds_dbname.arn}"
        },
                        {
            "name": "RDS_HOSTNAME",
            "valueFrom": "${aws_ssm_parameter.rds_hostname.arn}"
        },
                        {
            "name": "RDS_PORT",
            "valueFrom": "${aws_ssm_parameter.rds_port.arn}"
        },
                        {
            "name": "APP_SECRET",
            "valueFrom": "${aws_ssm_parameter.app_secret.arn}"
        }
    ],
    "environment": [
      {
        "name": "AWS_EMF_AGENT_ENDPOINT",
        "value": "tcp://127.0.0.1:25888"
      },
      {
        "name": "ENV_TYPE",
        "value": "prod"
      },
      {
        "name": "AWS_EMF_SERVICE_NAME",
        "value": "flaskapp"
      },
      {
        "name": "AWS_EMF_SERVICE_TYPE",
        "value": "AWS::ECS::Container"
      },
      {
        "name": "AWS_EMF_LOG_GROUP_NAME",
        "value": "flaskapp"
      },
      {
        "name": "AWS_EMF_LOG_STREAM_NAME",
        "value": "/ecs/emf_test"
      },
      {
        "name": "AWS_EMF_NAMESPACE",
        "value": "flaskapp"
      }
    ]
  },
  {
    "name": "cloudwatch-agent",
    "image": "public.ecr.aws/cloudwatch-agent/cloudwatch-agent:latest",
    "memory": 256,
    "cpu": 256,
    "portMappings": [{
        "protocol": "tcp",
        "containerPort": 25888
    }],
    "secrets": [
        {
            "name": "CW_CONFIG_CONTENT",
            "valueFrom": "${aws_ssm_parameter.cw_agent_config.arn}"
        }
    ],
    "logConfiguration": {
        "logDriver": "awslogs",
        "options": {
            "awslogs-group": "${aws_cloudwatch_log_group.ecs_logs.name}",
            "awslogs-region": "eu-west-2",
            "awslogs-stream-prefix": "ecs"
        }
    }
  }
]
Since we are using the aws-embedded-metrics-python package to send the metrics from the application, we need to create a Task IAM role with the CloudwatchAgentPolicy. The application container also has additional EMF specific environment variables which will be retrieved by the python package. These include:
- AWS_EMF_AGENT_ENDPOINT - Required. This specifies the host and port of the CWAgent.
- AWS_EMF_SERVICE_NAME - Optional. Specifies the ECS service name in the logs.
- AWS_EMF_SERVICE_TYPE - Optional. Specifies the service type.
- AWS_EMF_LOG_GROUP_NAME - Optional. Specifies the log group.
- AWS_EMF_LOG_STREAM_NAME - Optional. Specifies the log stream.
- AWS_EMF_NAMESPACE. Optional. Specifies the namespace for the metrics.
Note that for this example, we are declaring the environment variables explicitly. It can also be configured via the Config object from aws-embedded-metrics-python package in the application code.
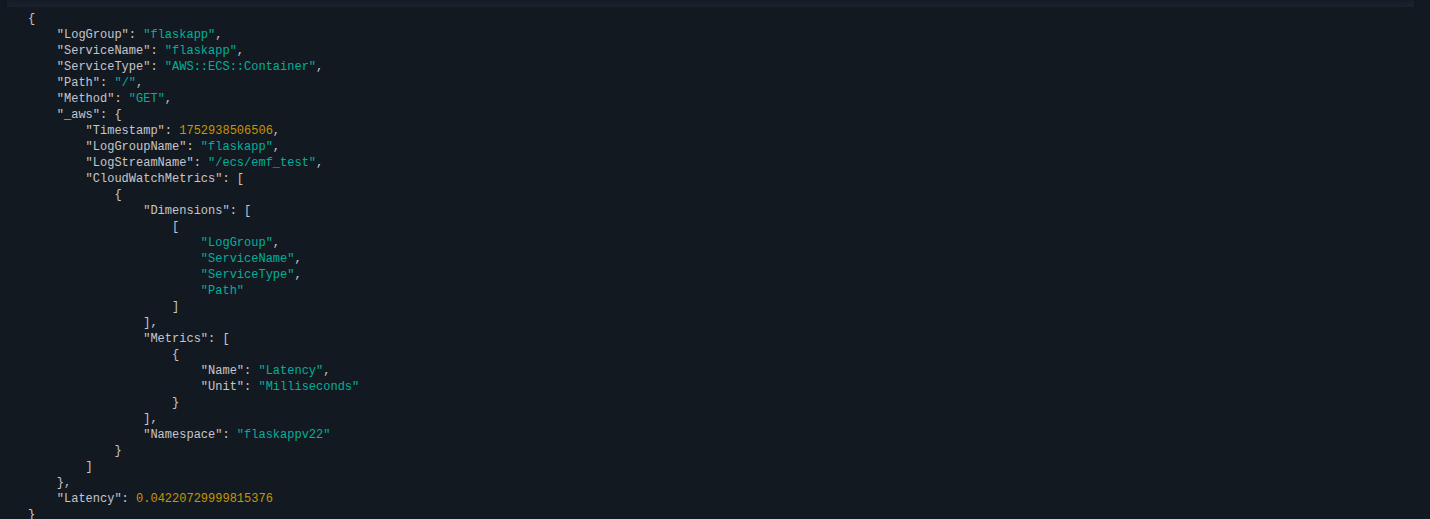
For our example flask app, we create a simple function that logs the application path, request method and latency as a metric. The function needs to have the metric_scope decorator which passes a metric object into the function. The example below shows the implementation of such a function:
    from aws_embedded_metrics import metric_scope

    @metric_scope
    def my_handler(path, method, duration, metrics):
        metrics.put_dimensions({'Path': path})
        metrics.put_metric('Latency', duration, 'Milliseconds')
        metrics.set_property('Method', method)
        metrics.set_property('Path', path)
        metrics.set_namespace('flaskappv22')
        metrics.set_timestamp(datetime.datetime.now())
The put_dimensions method adds the Path metric as an additional dimension. The package adds ServiceType, ServiceName, LogGroup as default dimensions. You can use set_dimensions to override these and only have your custom dimensions. The put_metric records the metric value to track. In this example, we are tracking the latency of each request. We can record other values which are not published as metrics using set_property.
Once deployed, the log stream should contain entries such as the following:
To view the metrics recorded, we can view it via Metrics > All and select the namespace. The screenshot below shows an attempt to retrive and visualize the metrics recorded:
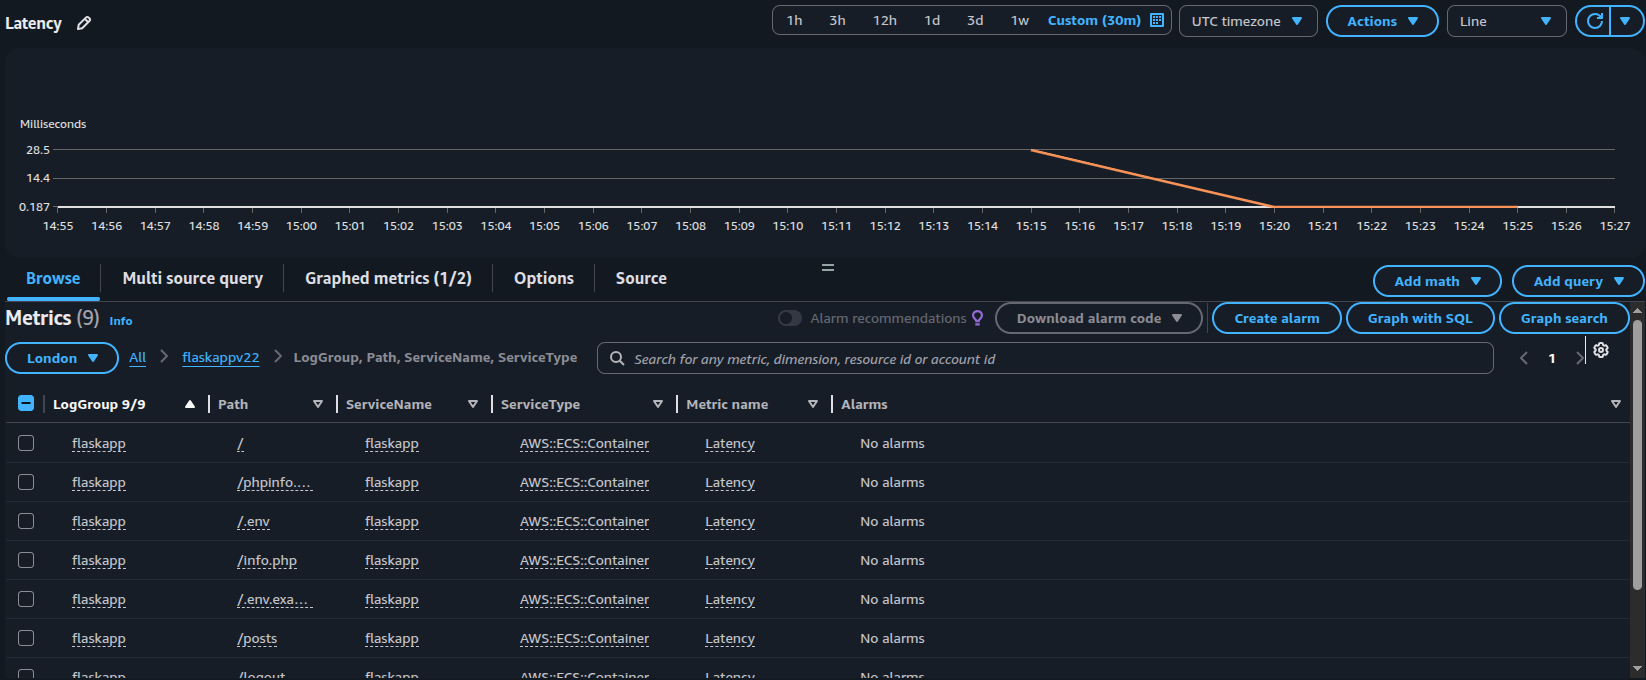
In summary, we can embed custom Cloudwatch Metrics using Embedded Metric Format with structured query logging which would allow Cloudwatch to retrieve the metrics values for creating cloudwatch alarms or for deeper analysis of the logs via Cloudwatch Logs Insights.